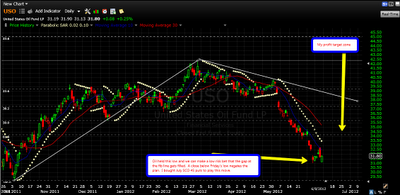
My thoughts are noted on the charts themselves, but it sure appears to me that a huge relief rally is in process. My view is, contrary to all of the posturing, printing will be occurring in all the major currencies.
China started the ball rolling, Japan is always on board, Europe started Saturday with the Spanish bailout, and the FED will be buying up Treasuries and MBS, whether they announce it or not. I'd be surprised if the lows last week are taken out without a strong move higher first.
My longer term buy / sell signals on the metals, energy and the broad market are still flashing a sell, but they do lag a week or so, evidence of that, with gold and the market showing huge short covering moves in the last ten days. The miners have already flashed a buy and dip buying is my plan.
Regarding my published trades, you can see the score below, but I also trade options and have been doing very well in shorting the leveraged ETF's on big moves higher or trend changes. The robots are mean reverting a lot and it makes for a relatively easy trade. FAZ, DUST, and TZA have been my prey. I also am doing a lot of condors inside of these support resistance lines. My directional bets with GLD and SLV have been losers, but mitigated with selling calls against them with weeklies. They are July's and are at or in the money for the most part. I have high hopes for them.
My trade performance from my signals Y-T-D is 26% on 130 trade signals, my current trades are below. My AGQ trade performance is up 387% from August 2010, and we are currently long in the trade. $20K reinvested on all buy and sells is worth $216,294, sans commission and taxes. Enjoy the charts and feedback is appreciated.


BOB
ReplyDeletejust wanted to say "Good charts and nice work". I saw quite a few BEARS out there in Gold, Oil, SPX before the Spain bail out...but you had BULLISH charts posted before the bail out announcement.
Nice work!
ALEX
Thanks Alex
DeleteThanks Bob.
ReplyDeleteYou are welcome
DeleteOn the SSRI chart - can you explain what you mean - "I will go 3 to one"?
ReplyDeleteI am accumulating SSRI and have been buying and selling a specific lot of stock on up and down days at a 2 to 1 ratio. When it crosses the next downtrend line and moves up I will buy in a ratio of 3x the shares on down days to one lot sold on up days.
Delete